library(tidyverse)
library(mclust)
cities15000_csv <- read_csv("cities15000.csv")Table of Content
- 1 Introduction
- 2 k-Means
- 3 Conclusion
1 Introduction
The k-means algorithm is a calculation method that can be used for grouping objects, the so-called cluster analysis. Thanks to the efficient calculation of the cluster centers and the low memory requirements, the algorithm is very well suited for the analysis of large amounts of data, as is usual in the big data environment.
The k-means algorithm is one of the most commonly used mathematical methods for grouping objects (cluster analysis). The algorithm is able to determine from a set of similar objects with a previously known number of groups the respective centers of the clusters. Because it is a very efficient method that can handle many different data types, and memory requirements are low, the k-Means algorithm is suitable for data analysis in the big data environment.
For this post the dataset cities15000 from the statistic platform “Kaggle” was used. A copy of the record is available at https://drive.google.com/open?id=1PyXaRTuQ0v9RMa8EKh-dUmG9QHNiuE0Y.
2 k-Means
The dataset we have contains information (including longitude and latitude) about 23 thousand cities around the world.
nrow(cities15000_csv)## [1] 23469We now want to test the functionality of the k-Means algorithm on the basis of the 5k largest cities.
WorldCities <- cities15000_csv %>% arrange(desc(population)) %>%
                  head(5000) %>% select(longitude, latitude)

glimpse(WorldCities)
## Observations: 5,000
## Variables: 2
## $ longitude <dbl> 121.45806, 28.94966, -58.37723, 72.88261, -99.12766,...
## $ latitude <dbl> 31.22222, 41.01384, -34.61315, 19.07283, 19.42847, 3...clust <- WorldCities %>% kmeans(centers = 6) %>%
fitted("classes") %>% as.character()
WorldCities <- WorldCities %>% mutate(cluster = clust)
WorldCities %>% ggplot(aes(x=longitude, y=latitude)) +
geom_point(aes(color=cluster), alpha = 0.5) +
ggtitle("The world's 5.000 largest cities, clustered by the 6-means cluster algorithm") +
xlab("Longitude") + ylab("Latitude")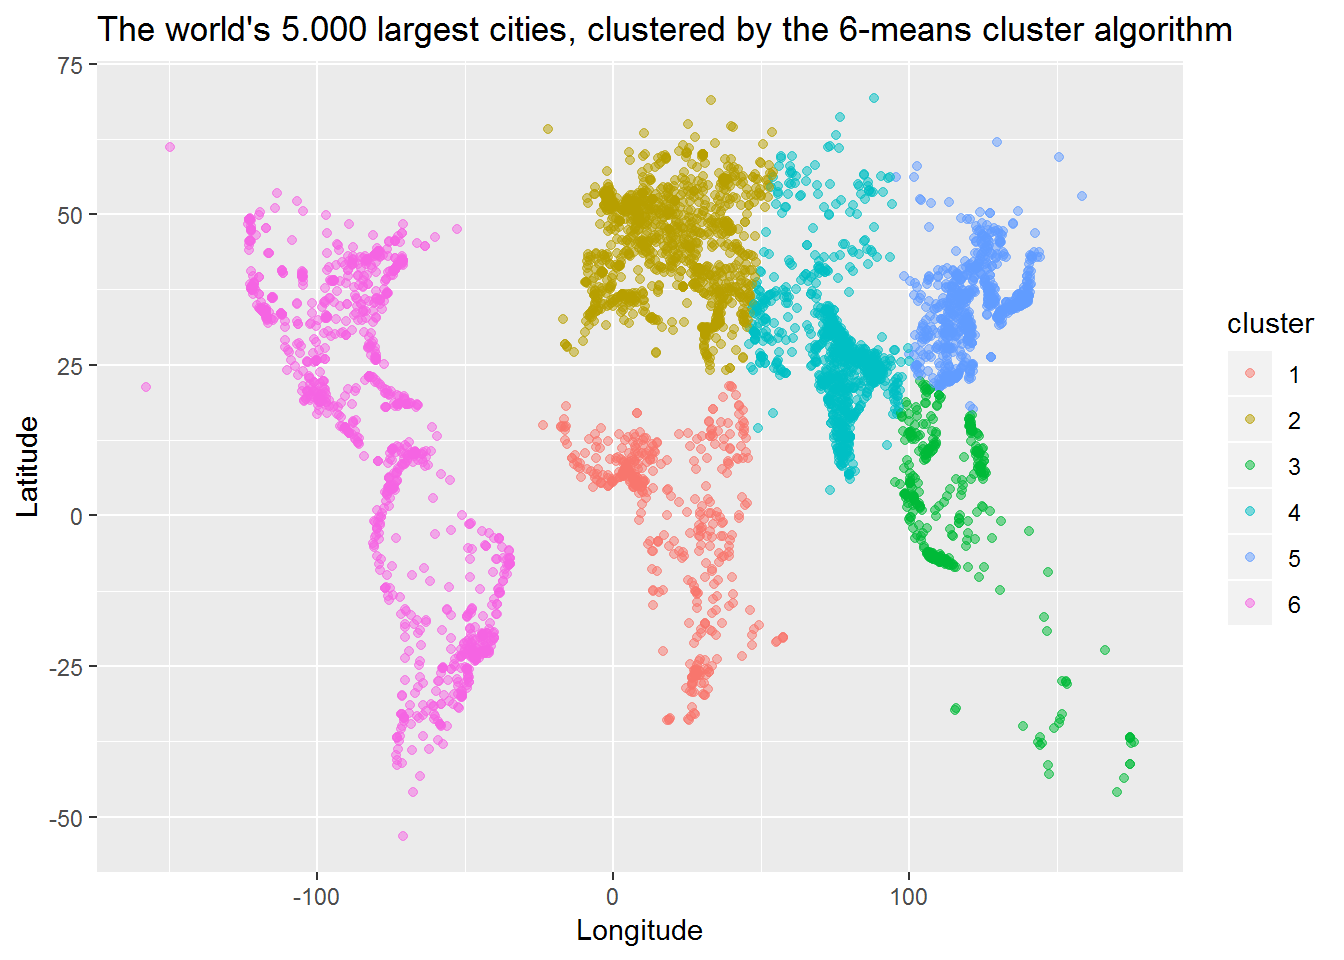
k-Means works pretty well at first glance !
3 Conclusion
Cluster analysis is a technique that divides a certain number of objects into homogeneous groups. The goal is that the different objects within a group are as similar as possible after the division has been made. The properties of the objects are divided into dimensions. The groups are called clusters. The k-means algorithm applies to multi-dimensional objects and approaches the cluster centers through repetitive recalculations until no significant change occurs.
Source
Baumer, B. S., Kaplan, D. T., & Horton, N. J. (2017). Modern data science with R. Chapman and Hall/CRC.