library(tidyverse)Table of Content
- 1 Introduction
- 2 Creation of two dependent variables
- 3 The training and testing of a regression model with a simple random sample
- 4 The training and testing of a regression model with cross validation
- 5 Conclusion
1 Introduction
Cross validation is a technique for evaluating the performance of a model in machine learning. With new datasets, which were not used in the training phase, the quality of the prediction is checked. This is done by partitioning a record into subsets for training and testing the algorithm. Because cross-validation does not use all data when developing a model, it is a commonly used method to prevent over-fitting during exercise. Each pass of cross validation involves random partitioning of the original record into a training set and a test set. The training set is used to train an algorithm for supervised machine learning and the test set is used to evaluate its performance. This process is repeated several times and the mean cross-validation error is used as the performance indicator.
2 Creation of two dependent variables
set.seed(123)


x <- rnorm(200, 2, 1)
y <- exp(x) + rnorm(9, 2, 3)
## Warning in exp(x) + rnorm(9, 2, 3): Länge des längeren Objektes
## ist kein Vielfaches der Länge des kürzeren Objekteslinear <- lm(y ~ x)
plot(x, y)
abline(a = coef(linear[1], b = coef(linear[2], lty = 2)))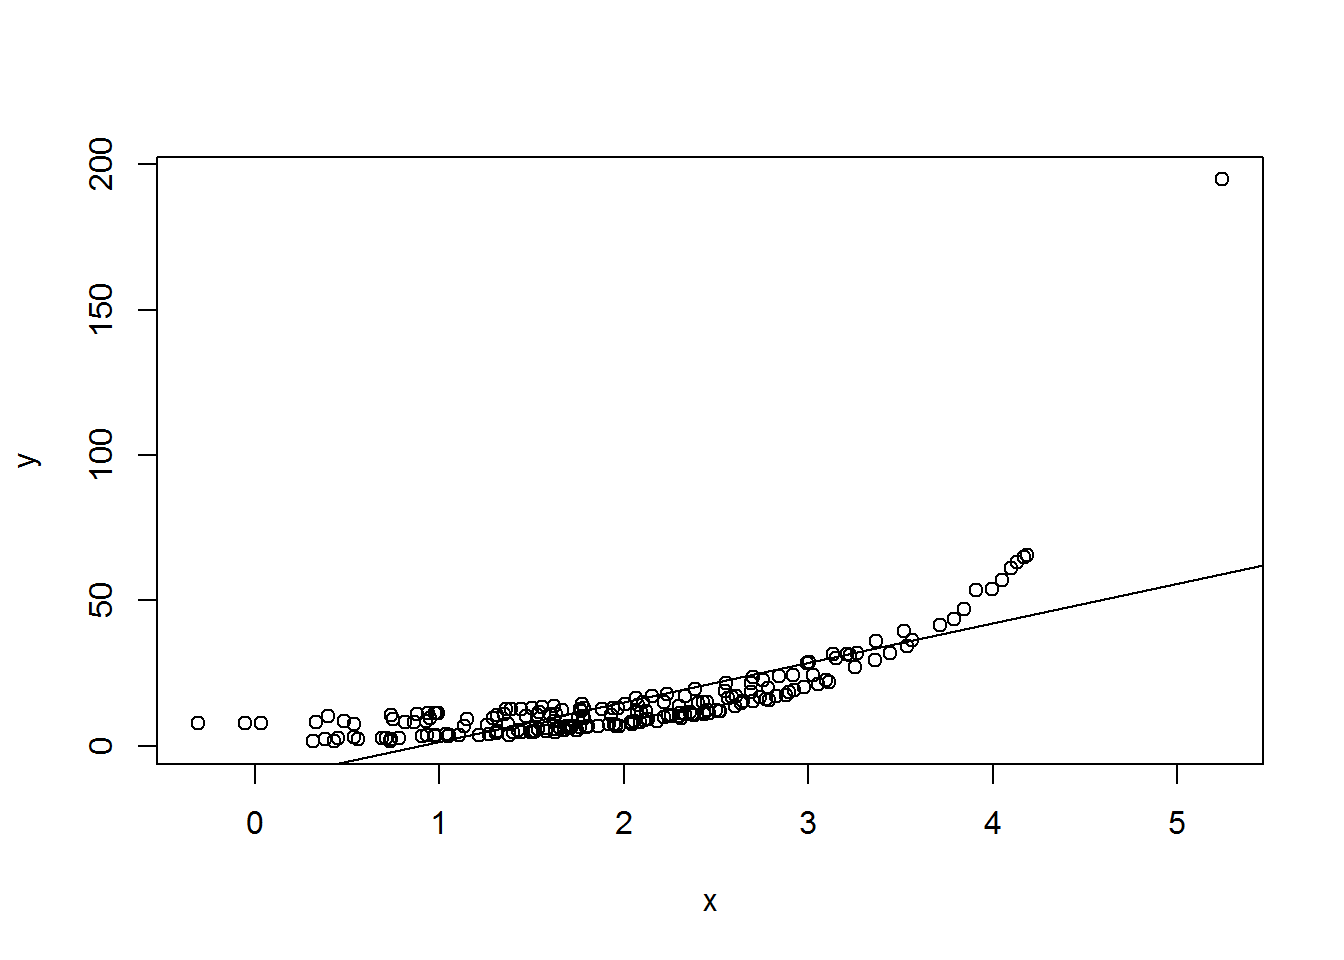
data <- data.frame(x, y)3 The training and testing of a regression model with a simple random sample
data.samples <- sample(1:nrow(data), nrow(data) * 0.7, replace = FALSE)

training.data <- data[data.samples, ]
test.data <- data[-data.samples, ]

train.linear <- lm(y ~ x, training.data)
train.output <- predict(train.linear, test.data)


RMSE.df <- data.frame(predicted = train.output, actual = test.data$y,
                      SE = ((train.output - test.data$y)^2/length(train.output)))

head(RMSE.df)
## predicted actual SE
## 2 12.313998 11.807050 0.004283269
## 5 17.685741 9.165855 1.209807474
## 12 21.130655 11.793545 1.453027186
## 13 21.742714 14.661266 0.835781802
## 15 7.447376 4.809545 0.115969244
## 19 26.234560 23.496352 0.124963020sqrt(sum(RMSE.df$SE))## [1] 8.4530154 The training and testing of a regression model with cross validation
set.seed(123)

x <- rnorm(200, 2, 1)
y <- exp(x) + rnorm(9, 2, 3)
## Warning in exp(x) + rnorm(9, 2, 3): Länge des längeren Objektes
## ist kein Vielfaches der Länge des kürzeren Objektesdata <- data.frame(x, y)
data.shuffled <- data[sample(nrow(data)), ]
folds <- cut(seq(1, nrow(data)), breaks = 10, labels = FALSE)
errors <- c(0)
for(i in 1:10) {
fold.indexes <- which(folds == i, arr.ind = TRUE)
test.data <- data[fold.indexes, ]
training.data <- data[-fold.indexes, ]
train.linear <- lm(y ~ x, training.data)
train.output <- predict(train.linear, test.data)
errors <- c(errors, sqrt(sum(((train.output - test.data$y)^2/length(train.output)))))
}
errors[2:11]## [1] 7.056986 5.701666 7.530482 8.845505 7.015440 6.856132 7.850848
## [8] 9.096584 33.358992 6.809931mean(errors[2:11])## [1] 10.012265 Conclusion
In this case, we can see that cross-validation (RMSE: 10.01) is worse than simple sampling (RMSE: 8.45).
Source
Burger, S. V. (2018). Introduction to Machine Learning with R: Rigorous Mathematical Analysis. " O’Reilly Media, Inc.“.